How to Spot Confounders: Unraveling the True Story Behind the Data

Have you ever seen a headline that makes you scratch your head? Something like “Eating more ice cream leads to more shark attacks!” or “People who drink coffee are more likely to get lung cancer!” While these might sound alarming, they’re often examples of a sneaky culprit in research: the confounder. As medical students and researchers, understanding confounders isn’t just an academic exercise; it’s crucial for interpreting studies, designing effective interventions, and ultimately, making better decisions for patient care. In this blog post, we’ll intuitively define what a confounder is, explore practical ways to spot them, and look at some examples – both clinically relevant and a bit of fun – to help you become a confounder-spotting pro! What Exactly Is a Confounder? Imagine you’re trying to figure out if X causes Y. A confounder (let’s call it Z) is like a hidden puppeteer. It’s a factor that influences both X and Y, making it seem like X is directly causing Y, when in reality, Z is pulling the strings for both. Here’s the key: a confounder is associated with both the exposure (X) and the outcome (Y), but it’s not on the causal pathway between X and Y. If you don’t account for Z, you might incorrectly conclude that X causes Y, or you might overestimate or underestimate the true effect of X on Y. Think of it this way: Practical Strategies for Becoming a Confounder Detective Spotting confounders requires a blend of critical thinking, knowledge, and sometimes, a little bit of detective work. Here are some key strategies: 1. Leverage Domain Knowledge and Literature Review Your understanding of the subject matter is your first and most powerful tool. Before even looking at data, ask yourself: A thorough literature review can illuminate common confounders in your field of interest. For instance, in many health studies, age, sex, socioeconomic status, and lifestyle factors (like diet and exercise) are frequently confounders and should always be considered. 2. The “Why Else?” Brainstorm: Your Inner Skeptic This is perhaps the most intuitive and powerful strategy. When you see an association, don’t immediately jump to causation. Instead, ask: “Why else might these two things be related?” Let’s take a classic “fun” example: Example: Ice Cream Sales and Shark Attacks “Why else?” thinking: Do sharks suddenly develop a taste for humans when there’s more ice cream around? Unlikely! What’s a common factor that influences both ice cream consumption and beach activities? This simple example highlights how a third variable can create a misleading correlation. 3. Consider the Temporal Sequence: Cause Before Effect A true cause must precede its effect. This might seem obvious, but it’s a critical check for potential confounders. If a variable that you suspect is a confounder occurs after the exposure, it cannot be a confounder (though it might be a mediator or an outcome itself). 4. Check for Associations with Both the Exposure and the Outcome For a variable to be a confounder, it must meet two conditions: Let’s look at a clinically relevant example: Example: Coffee Drinking and Lung Cancer Checking the conditions: Because smoking is associated with both coffee drinking and lung cancer, and it’s not caused by coffee drinking, it confounds the relationship. When researchers accounted for smoking, the apparent link between coffee and lung cancer largely disappeared. 5. Causal Diagrams (DAGs): Visualizing the Relationships While we won’t deep dive into drawing them, understanding the principle of Causal Diagrams (Directed Acyclic Graphs, or DAGs) can be incredibly helpful. DAGs are visual tools that represent the assumed causal relationships between variables. In essence, you draw arrows from a cause to its effect. If you have an arrow from Z to X, and an arrow from Z to Y, but no direct arrow from X to Y (or the arrow from X to Y is what you’re trying to isolate), then Z is a confounder. They help you systematically identify potential confounding paths and determine which variables need to be controlled for in your analysis. Practical Tip: Even without formal DAG software, you can sketch out the relationships on a whiteboard or paper. This visual exercise can often reveal hidden confounders you hadn’t considered. More Examples to Hone Your Skills Clinically Relevant Example: Hormone Replacement Therapy (HRT) and Heart Disease Potential Confounder (Z): Socioeconomic Status/Healthy Lifestyle. When randomized controlled trials (like the Women’s Health Initiative) were conducted, they found that HRT actually increased the risk of heart disease in some women. The “protective” effect seen in observational studies was largely due to confounding by healthy lifestyle factors. Fun Example: Storks and Birth Rates Potential Confounder (Z): Rural Areas/Population Density. The presence of storks doesn’t cause babies (despite the folklore!). The underlying factor of living in a rural area influences both the likelihood of seeing storks and the birth rate. The Takeaway: Embrace Critical Thinking Confounders are everywhere in research, and failing to account for them can lead to misleading conclusions and potentially harmful recommendations. As you delve deeper into medical research, always approach findings with a healthy dose of skepticism. Ask “why else?” Visualize the relationships, consider the temporal sequence, and check for associations with both the exposure and the outcome. By doing so, you’ll be well on your way to unraveling the true stories behind the data and contributing to more robust and reliable scientific understanding.
How to Spot Good Research: Reading Papers with a Critical Eye (Part 2)

In our previous post, we discussed the initial steps of dissecting a scientific paper. Now, let’s dive deeper into some red flags and critical considerations to help you discern robust science from potentially misleading claims. 1. The Selective Spotlight: What’s Missing from the Narrative? Scientific papers highlight significant findings. But a critical reader asks: What predefined results were not mentioned? Many studies, especially clinical trials, register their protocols outlining specific endpoints before data collection. If these pre-specified outcomes are absent from the results, it raises a critical question: Why? Were they not “significant,” or perhaps contradictory? Example: A drug trial protocol registers several primary and secondary outcomes, including patient-reported pain and a specific quality-of-life measure. The published paper then focuses solely on a statistically significant reduction in pain, making no mention of the quality-of-life data. If predefined outcomes aren’t reported, investigate why. You can often find registered protocols (e.g., on ClinicalTrials.gov) using a trial registration number in the paper’s methods section. 2. The P-Value Predicament: When “Significance” Means Little A p-value less than 0.05 is often deemed “statistically significant.” However, an over-reliance on p-values without context can mislead. Example: A new blood pressure medication is tested, and the study finds a statistically significant reduction in systolic blood pressure with a p-value of 0.03. However, upon closer inspection, the absolute reduction in blood pressure is only 1.5 mmHg. While statistically significant, a 1.5 mmHg reduction might be clinically negligible for most patients and may not justify potential side effects or costs of the new medication. Critical Takeaway: Don’t let a low p-value blind you to the actual magnitude and clinical relevance of the effect. Always consider the effect size and confidence intervals alongside the p-value. 3. Correlation vs. Causation: Beware the Causal Leap Just because two things are linked doesn’t mean one causes the other. Authors sometimes imply causation when their study design only shows correlation. Example: A study finds a strong correlation between shoe size and salary. It would be incorrect to conclude that having larger feet leads to a higher salary. A more plausible explanation is that, historically, certain higher-paying professions have been predominantly held by men, who, on average, have larger shoe sizes than women. The underlying factor isn’t foot size, but gender and historical workplace demographics. Another Example: A study finds a strong correlation between ice cream sales and drowning incidents. This doesn’t mean eating ice cream causes drowning. The confounding variable here is likely the time of year: both ice cream sales and swimming (and thus drowning incidents) increase during hotter summer months. Critical Takeaway: Always scrutinize the study design. Randomized controlled trials are the gold standard for demonstrating causation, while observational studies (cohort, case-control, cross-sectional) can only suggest associations or correlations. 4. Graph Grievances: Don’t Let Visuals Deceive You Graphs can powerfully summarize data, but they can also be manipulated to create a misleading impression of results. Example: A bar graph shows a dramatic difference between a control group and a treatment group. However, if you look closely at the y-axis, you might find that it doesn’t start at zero, or that the scale is truncated, exaggerating a small difference. A change from 10 to 12 (a 20% increase) might look enormous if the y-axis only ranges from 9 to 12. Advice: 5. Definitional Discrepancies: What Exactly Are They Studying? Scientific terms can be defined differently across studies. This creates confusion and makes comparing findings difficult. Example: The term “high-risk patient” in a cardiology study could be defined differently by various authors. One study might define it based on the presence of three or more cardiovascular risk factors, while another might use a specific score from a risk assessment tool. If the authors don’t clearly define their terms, or if they deviate from standardized and referenced definitions, it becomes challenging to interpret their findings in context. Additional Red Flags: By developing a critical eye and looking for these red flags, you can truly engage with scientific literature and distinguish robust research from less reliable claims. Happy reading!
Untangling the Evidence: Why “Intention-to-Treat” is Your Best Friend in Learning from Clinical Trials

At Briefio, we’re all about making complex information digestible and empowering you to learn smarter. If you’ve ever delved into medical research, particularly about new treatments or interventions, you’ve likely encountered terms like “Randomized Controlled Trials” (RCTs). These are often called the “gold standard” of evidence. But within RCTs, there’s a critical distinction in how results are analyzed that can completely change your interpretation: Intention-to-Treat (ITT) versus Per-Protocol (PP) analysis. Understanding this difference is not just for statisticians; it’s essential for anyone who wants to truly grasp the real-world implications of medical research. Think of it as a key to unlocking deeper insights from the data. The Problem: Life Isn’t Perfect (and Neither are Clinical Trials) Imagine a clinical trial testing a new blood pressure medication. Participants are randomly assigned to either the new drug or a placebo. This randomization is crucial because it ensures the groups are initially comparable, minimizing bias. But then, life happens: If you only analyze the data from patients who perfectly followed the rules, you’re looking at a very specific, often unrealistic, subset. This is where ITT and PP come in. Per-Protocol (PP) Analysis: The “Ideal World” Scenario What it is: Per-Protocol analysis only includes data from participants who strictly adhered to the study protocol – meaning they took all their assigned medication, completed all visits, and had no major deviations. The catch: While it aims to show the maximum possible effect of a treatment under ideal conditions (its “efficacy”), it has a major flaw for real-world learning: it breaks the power of randomization. When you cherry-pick only the “perfect” participants, the groups you’re comparing are no longer truly random. Patients who drop out due to side effects, for example, are inherently different from those who tolerate the treatment well. Excluding them can make a treatment look much better than it actually is, because you’re essentially removing the patients for whom it didn’t work or caused problems. Think of it like this: Imagine a fitness challenge. A Per-Protocol analysis would only count the participants who finished every single workout, ate perfectly, and never missed a day. While their results might be impressive, they don’t reflect the experience of everyone who started the challenge. Intention-to-Treat (ITT) Analysis: The “Real World” Truth What it is: Intention-to-Treat analysis analyzes participants based on their initial randomized assignment, regardless of whether they actually completed the intervention, adhered to it, or even dropped out. Why it’s the gold standard for learning: Think of it like this: In our fitness challenge, an Intention-to-Treat analysis would include everyone who signed up, even if they dropped out after a week. Their results might not be as dramatic as the “perfect” participants, but they give a much more accurate picture of the overall success rate of the program for everyone who tried it. Your Briefio Takeaway: Always Look for ITT! When you’re consuming medical information, especially from RCTs, make it a habit to check how the data was analyzed. Understanding the difference between ITT and PP isn’t just academic; it directly impacts how you interpret research and, ultimately, how you understand what works (and what doesn’t) in the real world. At Briefio, we believe that informed learning starts with understanding the nuances, and this distinction is a perfect example. What other tricky aspects of research interpretation would you like us to simplify for your learning journey? Let us know in the comments!
Breaking into Medical Affairs: Your First Steps and Ideal Roles

Are you a science enthusiast with a passion for communication and a desire to bridge the gap between groundbreaking research and patient care? Medical Affairs might just be the perfect fit for your career. This dynamic field within the pharmaceutical and biotech industry offers a unique opportunity to leverage your scientific expertise in a non-commercial setting. But where do you start, and what roles are best for someone new to the field? As someone who interviews candidates for Medical Affairs positions, I’m often asked these questions. Let’s explore some common entry points and what it takes to succeed. Common Entry-Level Roles in Medical Affairs While the Medical Affairs landscape is diverse, three roles often serve as excellent starting points for a career in this field: Medical Science Liaison (MSL) Who it’s for: If you thrive on scientific exchange, enjoy building relationships, and are comfortable traveling frequently, the MSL role could be your calling. MSLs are the scientific face of the company, engaging in peer-to-peer discussions with Key Opinion Leaders (KOLs) and other healthcare professionals to share scientific information and gather insights. What we look for: Medical Information Specialist Who it’s for: If you have a meticulous eye for detail, excellent research skills, and a talent for clear scientific writing, a Medical Information Specialist role might be an ideal fit. This position is typically office-based and involves responding to unsolicited requests for medical information from healthcare professionals and consumers. What we look for: Medical Advisor Who it’s for: Medical Advisors are the strategists of the Medical Affairs department. While often requiring some prior industry or Medical Affairs experience, it can be an entry point for highly qualified individuals, particularly those with an MD or PhD, who demonstrate strong leadership and strategic thinking. What we look for: What I Look for in a CV and During an Interview When I’m reviewing CVs and conducting interviews, I’m looking for a combination of scientific rigor, practical skills, and personal attributes that indicate a strong fit for the demanding yet rewarding world of Medical Affairs. Your CV: Make It Stand Out The Interview: Your Opportunity to Connect My interviews typically start with a brief introduction from me to create a relaxed and inclusive atmosphere. Then, it’s your turn to walk me through your career journey, highlighting skills and experiences relevant to the job description. The conversation then transitions into a Q&A session. Here’s what I’ll be looking for: Your Turn to Ask: Show Your Interest The end of the interview is your critical opportunity to ask questions. This shows your genuine interest, engagement, and that you’ve thought deeply about the role and the company. Avoid asking about salary at this stage; that’s typically handled by HR or a recruitment agent (especially in regions like Japan, where agents often navigate this sensitive topic). Here are a couple of examples of thoughtful questions you might consider: Ultimately, I’m looking for the best fit for our team: a knowledgeable and collaborative colleague who can quickly become independent, and from whom we can all learn. Diverse teams with varied backgrounds and skillsets are, in my experience, the strongest. Are you considering a career in Medical Affairs, or perhaps looking to make a switch? What aspect of this field excites you the most?
Medical Affairs: The Dynamic Heartbeat of Pharmaceutical Innovation

Medical Affairs is a relatively “young” department within the pharmaceutical industry, yet it’s rapidly become an indispensable pillar. Having spent years navigating various roles within this evolving field—from a Medical Advisor to Franchise or TA Lead in a country organization, and most recently as a Regional Lead in Asia Pacific—I’ve witnessed firsthand its profound impact and unique appeal.
Unleash Your Brainpower: The Winning Combo of Listening, Learning, and Movement

At Briefio, we’re all about maximizing efficiency and effectiveness in everything you do. What if we told you there’s a powerful, yet often overlooked, synergy that can supercharge your cognitive abilities and well-being? It’s the dynamic duo of combining listening and learning with exercise and sports. Recent scientific research provides compelling evidence that integrating physical activity with intellectual engagement isn’t just good for you – it’s a game-changer for your brain.
Mastering the Art of the Scientific Conference (When You’re Not Presenting)

Scientific conferences are bustling hubs of knowledge exchange, innovation, and networking. While presenting your own research is a fantastic experience, attending as a non-presenter offers a unique and equally valuable opportunity to immerse yourself in your field. Far from being a passive observer, you can actively shape your conference experience to gain insights, build connections, and fuel your own scientific journey.
Drowning in Papers? Your Guide to Staying Afloat in the Sea of Scientific Literature

For anyone working in science, the feeling is all too familiar: a new day, a new deluge of research papers. Whether you’re a seasoned professor, a busy clinician, or just someone who needs to stay current in your field, the sheer volume of new scientific literature can feel overwhelming. How do you keep up without sacrificing your daily routines (or your sanity)?
Decoding the Research Landscape: A Guide to Evidence Levels in Your Literature Review
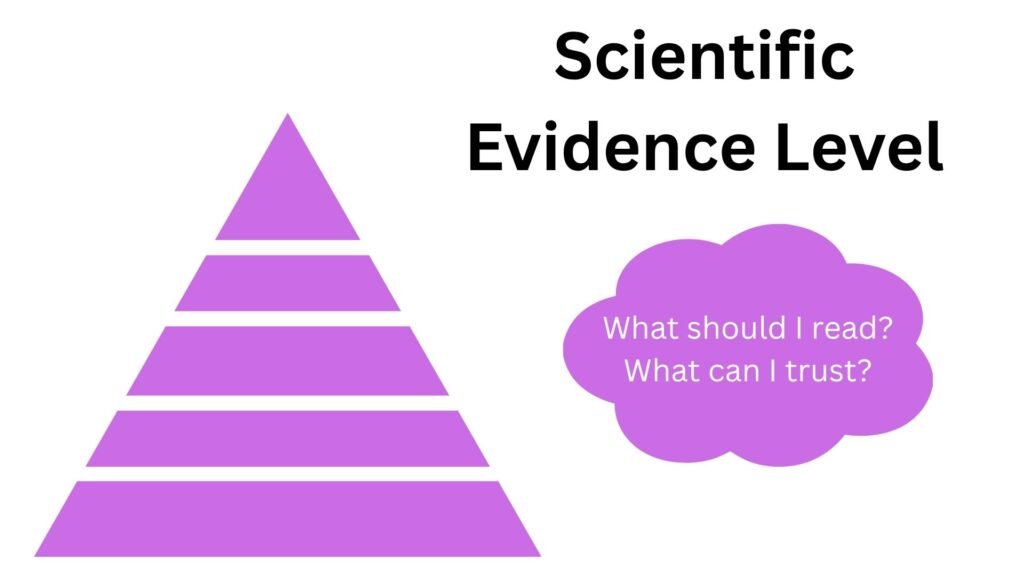
When I first started my research journey, the sheer volume of scientific literature felt like an endless ocean. How do you know which waves to ride and which to let pass? That’s where understanding different types of evidence and their “levels” becomes incredibly powerful. It’s not just about what’s published, but how strong that evidence is. Let’s dive in.
Mastering the Literature Review: From Overwhelm to Insight

Starting a PhD is an exhilarating journey, often marked by the thrill of diving into a new research area. But for many, including me when I first began, that initial excitement can quickly turn into a feeling of “where do I even begin?” especially when your specific topic is handed down by a mentor or research group. This is precisely where a well-executed literature review becomes your indispensable compass.